

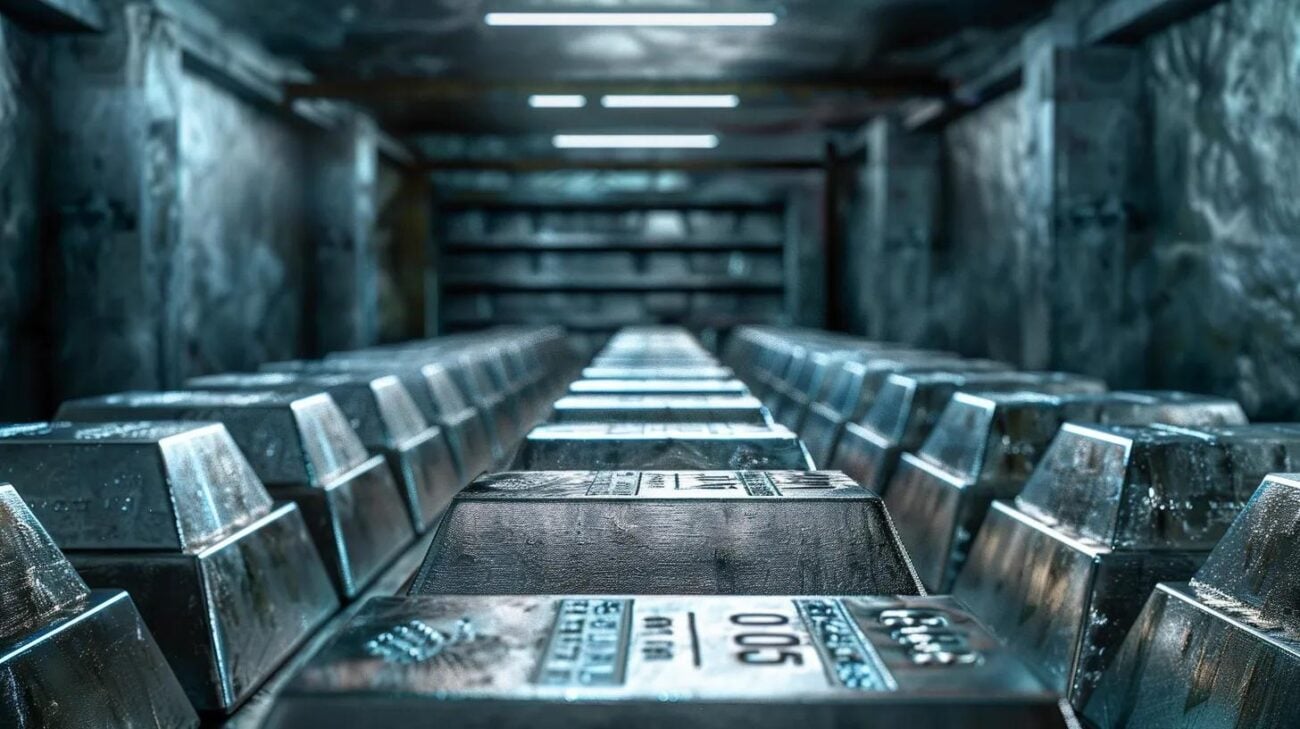
Silver Soars: Early December Insights
Silver surged to new nominal highs in December 2025 as a mix of macro shifts, tight physical markets and rising industrial demand converged. This piece breaks down the specific price ticks, shows how those numbers compare with past peaks in 1980 and 2011 (both nominal and inflation‑adjusted), and outlines the practical considerations for investors heading into 2026. You’ll find precise price summaries, apples‑to‑apples inflation adjustments, a data‑driven map of supply and demand forces, and a checklist of factors to weigh before changing exposure. Our analysis pulls together exchange ticks, ETF flows and supply‑deficit indicators to explain how monetary‑policy expectations, green‑technology demand and inventory draws combined to lift silver. Below we walk through the highest reported December 2025 prints, historical context, the core drivers behind the rally, silver versus gold, plausible 2026 scenarios, and pragmatic steps investors should consider.
What Was the Highest Silver Price Recorded in December 2025?
Multiple data feeds reported record highs during December 2025; differences stem from whether a source cites an intraday trade, a settlement close or a particular spot feed. Spot, nearby futures and intraday ticks can diverge by a dollar or more in volatile sessions, creating multiple legitimate “highest” figures. The table below lists representative highs from major channels and flags whether each figure was an intraday print or an official close. Knowing the difference matters: trading halts, thin liquidity windows and varying data‑wiring conventions can produce several credible high‑water marks.
| Source / Date | Price (USD per troy ounce) | Price type |
|---|---|---|
| Reported spot data (Dec 2025) | $59.655 | Intraday |
| Exchange settlement (Dec 2025) | $58.97 | Closing |
| Alternative data feed (Dec 2025) | $58.83 | Intraday |
| Broad-market aggregation (Dec 2025) | $59.655 | Intraday/aggregated |
Which Specific Price Points Appeared in December 2025?
The most widely cited intraday spike printed near $59.655 per ounce, while exchange settlement prices during the rally typically closed in the high‑$58 range. Intraday ticks capture the peak traded price during the session and can be fleeting; settlement closes are the official benchmarks used by many indices and contracts. Spot prints and nearby futures settlements can also differ, especially when margin flows and time‑of‑day liquidity gaps magnify moves. Tracing the timeline of intraday spikes versus end‑of‑day settlements reconciles why sources report slightly different record values.
That chronology also helps explain why traders and long‑term holders often treat intraday highs and official closes differently when measuring records.
In short: silver saw record prints around $59.655/oz (intraday) in December 2025, a level that exceeded prior nominal peaks such as the roughly $49.45/oz spike in January 1980 and the strong 2011 rally.
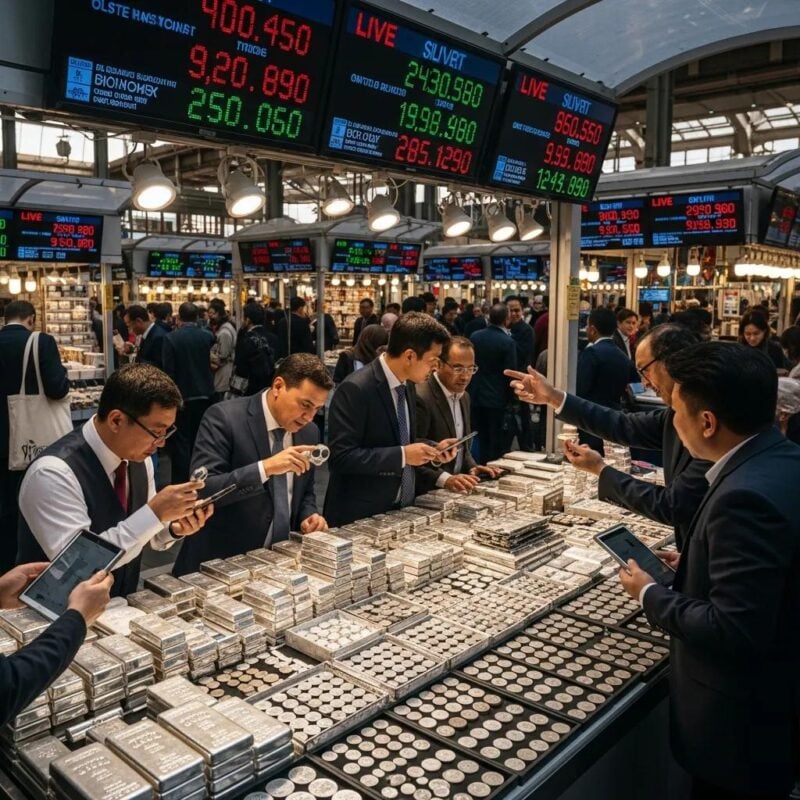
How Did Markets React to Silver’s December 2025 Rally?
The rally produced amplified volatility, concentrated ETF inflows and visible inventory draws that tightened the physical market. Futures volumes surged as positions were liquidated and rebalanced, retail interest accelerated, and ETFs registered meaningful additions that signaled fresh demand for deliverable metal. London and Shanghai visible inventories showed draws that lent credibility to higher prices. Short‑term volatility rose and margin calls on concentrated futures books forced rapid buying and selling, which in turn heightened intraday swings. The feedback loop was clear: rising prices triggered physical and ETF demand, which reduced available deliverable ounces and helped sustain higher settlement prints.
Those dynamics set the stage for comparing the 2025 peak with earlier historical highs and for why inflation‑adjusted comparisons matter.
How Does the December 2025 Peak Compare with Past Highs?
Nominally, the December 2025 intraday peak near $59.655/oz sits above commonly quoted 1980 and 2011 nominal highs. But nominal comparisons can mislead: converting earlier peaks into 2025 dollars shows whether December 2025 represents a true purchasing‑power record or mainly a nominal milestone. Below we explain our CPI‑style conversion approach and present a clear table of nominal and inflation‑adjusted peaks so you can see the assumptions and reproduce the math if needed.
What Were the 1980 and 2011 Nominal Peaks?
January 1980 featured an extraordinary spike commonly associated with the Hunt brothers’ accumulation and cornering attempts, often cited around $49.45/oz nominal. The 2011 rally reflected broad investor demand amid monetary stimulus and typically printed in the low‑to‑mid $40s per ounce (nominal), depending on the data feed. Those episodes had different market mechanics: 1980 was characterized by concentrated price manipulation and delivery pressure, while 2011 was a widespread precious‑metals surge driven by reflationary positioning and investor flows. Those distinctions matter when judging whether 2025 marks a new structural regime for silver.
How Do Inflation‑Adjusted 1980 and 2011 Peaks Stack Up Against 2025?
We convert historical nominal peaks into 2025 dollars using a standard CPI‑style chain index to provide apples‑to‑apples comparisons. The table below shows nominal peaks and their CPI‑adjusted equivalents in 2025 dollars. Note that using alternate inflation measures or indices will change the adjusted values; this method is transparent so readers can test different assumptions.
| Year / Event | Nominal peak (USD/oz) | Inflation-adjusted (USD/oz, 2025 dollars) |
|---|---|---|
| Jan 1980 (Hunt era) | $49.45 | $190.00 (approx., CPI-adjusted) |
| 2011 rally | ~$48.00 (nominal range) | $65.00–$70.00 (approx., CPI-adjusted range) |
| Dec 2025 peak | $59.655 | $59.655 (nominal, 2025 dollars) |
These adjusted figures illustrate that, with common CPI conversions, the 1980 nominal high can equal a materially higher real price than the 2025 nominal record. That underlines why inflation‑adjusted context matters when interpreting “all‑time” claims.
Why Did Silver Surge in 2025? The Key Drivers
The December 2025 rally was driven by several interacting forces: expectations of monetary easing, multi‑year supply deficits, stronger industrial demand from green technologies, and safe‑haven flows amid geopolitical friction. These channels work together—rate‑cut expectations lower real yields and lift demand for non‑yielding assets; supply deficits and inventory draws reduce deliverable metal; and rising industrial use increases baseline consumption. Below we map each driver to its transmission mechanism and note supporting metrics that quantify the recent impact.
| Driver | Mechanism | Supporting metric / quantitative note |
|---|---|---|
| Fed rate-cut expectations | Lower real yields increase appeal of non-yielding metals | Markets priced-in cuts, weakening real yields in 2025 |
| Supply deficits | Annual deficits reduce available deliverable ounces | 2024 deficit ~148.9m oz, inventory draws reported |
| Industrial demand (green tech) | Higher per-unit silver consumption in PV/EV electronics | Industrial demand ~680.5m oz in 2024 (Silver Institute figure) |
| ETF and investor flows | Net inflows add demand and concentrate holdings | December 2025 ETF additions measured in tens to hundreds of tons |
That combination of macro and physical factors made the market particularly sensitive to incremental news, producing the strong late‑2025 rally.
How Do Federal Reserve Rate Cuts Affect Silver?
When markets anticipate lower policy rates, real yields tend to compress and the opportunity cost of holding non‑yielding assets falls. That dynamic often prompts rotations into precious metals for inflation protection and diversification, lifting prices. In 2025, expectations of easing—and a coincident weakening of the dollar—helped amplify silver’s move. Historical patterns show metals frequently rally around easing cycles as investors reassess real returns and risk allocations.
Monetary factors set the backdrop; physical supply and industrial demand converted that backdrop into sustained price pressure.
What Part Did Supply Deficits and Industrial Demand Play?
A tight physical market magnifies the price response to incremental demand because deliverable ounces become scarcer and visible inventories fall. Silver Institute figures pointed to elevated industrial demand (about 680.5 million ounces in 2024) alongside a multi‑year supply deficit near 148.9 million ounces, which together drained inventories and raised the marginal cost of additional supply—supporting higher prices when demand stepped in.
Frequently Asked Questions
What were the primary drivers of silver’s 2025 rally?
The rally reflected a convergence of factors: expectations of Fed rate cuts that lowered real yields, persistent supply deficits that tightened available metal, rising industrial demand—especially from green tech—and meaningful inflows into silver ETFs. Together these elements created strong upward pressure on prices.
How do geopolitical events influence silver prices?
Geopolitical uncertainty tends to push investors toward safe havens, including precious metals. Heightened tensions or market stress can increase demand for silver as a diversification and store‑of‑value asset, contributing to price spikes during unsettled periods.
Why do ETF inflows matter for silver?
ETFs are a major channel for investor exposure to silver without holding physical metal directly. Large ETF inflows translate into greater demand for bullion to back those holdings, tightening supply and reinforcing price moves. In 2025, significant ETF additions were an important amplifying factor.
How did silver’s performance compare with gold in 2025?
Silver often outpaced gold in percentage terms in 2025, driven in part by its industrial demand profile and a lower absolute price point that can attract more retail participation. Both metals benefited from safe‑haven and macro drivers, but silver’s industrial linkage and thinner market depth can produce larger swings.
What are the main risks of investing in silver?
Silver is volatile: prices can move sharply on sentiment, macro shifts, inventory changes or speculative flows. Supply chain disruptions and shifts in industrial demand also add uncertainty. Leveraged instruments like futures and options increase risk, so investors should weigh volatility and liquidity when sizing positions.
How can investors approach silver exposure?
Options include holding physical bullion (coins or bars), investing via silver ETFs for liquidity and diversification, or trading futures and options for directional or leveraged exposure. Each route carries trade‑offs—storage and insurance for physical, tracking and fees for ETFs, and margin risk for derivatives—so align the vehicle with your time horizon and risk tolerance.
Conclusion
December 2025 was a defining month for silver: macro signals, constrained supply and rising industrial demand combined to produce notable nominal records. For investors, the episode underlines the importance of separating intraday prints from settlement highs, using inflation‑adjusted context for historical comparisons, and weighing both macro and physical drivers before changing exposure. If you want to dig deeper, our research hub contains data tables, inflation‑adjustment methodology and scenario analyses to help you make informed decisions.