Gold and silver are two foundational store-of-value assets whose price histories reveal how monetary policy, inflation, industrial demand, and geopolitical shocks shape investor behavior. Over 55 years, gold has risen from $35 to over $4,000 per ounce, while silver has surged from $1.50 to nearly $50 multiple times; this article uses that long view to show when each metal has historically protected wealth and when each has delivered outsized gains. Readers will gain a decade-by-decade narrative from the 1970s through 2025, a clear definition and practical use-cases for the gold–silver ratio, and a data-driven comparison of volatility, storage and liquidity considerations for both metals. The goal is to convert historical insight into actionable portfolio rules of thumb and rebalancing triggers while offering practical places to check live spreads and availability. Below we examine price milestones, sample ratio datapoints, macro drivers, comparative performance metrics, investor takeaways for 2025 and beyond, and how to access live prices and investment opportunities.
What Are the Key Historical Gold and Silver Price Trends from 1970 to 2025?

Gold and silver price trends from 1970 to 2025 reflect shifts in monetary regimes, inflation cycles, speculative episodes, and industrial cycles; both metals have alternated between long consolidations and sharp spikes driven by different economic impulses. The 1970s introduced free-floating price discovery after the decoupling of the U.S. dollar from gold, producing inflation-driven demand, while episodic cornering attempts and subsequent regulatory responses created extreme volatility in silver. The 1980s and 1990s were dominated by monetary tightening and disinflation that compressed precious-metals returns into ranges, before the 2000s commodities supercycle and financial crisis pushed safe-haven flows higher. The 2010s saw post-crisis normalization with intermittent spikes most notably in silver during 2011 while the 2020s have combined pandemic shock, supply-chain disruptions, and renewed inflation pressures to push prices to fresh highs by 2025. Understanding those decades provides context for interpreting current price levels and crafting allocation decisions.
This table shows selected annual-average and milestone datapoints that illustrate the long-run trajectory and highlight inflection years:
| Year / Milestone | Gold Annual Avg (USD/oz) | Silver Annual Avg (USD/oz) |
|---|---|---|
| 1970 (start) | $35 | $1.50 |
| 1980 (peak era) | $850 | $49 |
| 2000 (turn of era) | $279 | $4.95 |
| 2011 (spike) | $1,900 | $48 |
| 2025 (recent) | ~$4,000 | ~$48 |
This table highlights how both metals moved from monetary-era benchmarks in 1970 to speculative and macro-driven peaks in 1980, 2011, and 2025. The decade-level pattern is one of structural appreciation for gold with episodic silver surges tied to industrial or speculative demand, and the next section breaks those decades down into their key drivers.
How Did the 1970s Economic Events Impact Gold and Silver Prices?
The 1970s marked a fundamental regime shift when the Bretton Woods system ended and the U.S. dollar was untethered from gold, allowing market prices to emerge and prompting investors to seek inflation hedges. Surging consumer prices, repeated oil shocks, and loose nominal policy encouraged capital to flee fiat exposure and seek precious metals, driving gold from fixed parity into a free market that peaked in the late 1970s and 1980. Silver attracted both investor demand and speculative activity; the Hunt Brothers’ attempt to corner the silver market late in the decade produced an extreme spike approaching $49 per ounce. These events produced two durable lessons: first, changes to monetary regime and high inflation powerfully drive gold demand, and second, concentrated speculative positions can create abrupt, extreme moves in silver that reverse quickly once margins or regulations tighten.
Precious Metals Prices, Inflation, and Monetary Policy One of the findings of particular interest, especially for South Africa, is that changes in precious metals prices, particularly gold, may serve as leading indicators for inflation and are statistically associated with interest rate dynamics. … OF THE STATISTICAL RELATIONSHIP BETWEEN PRECIOUS METALS PRICES AND OTHER MONETARY POLICY VARIABLESAND INFLATION IN SOUTH …, RT Mpofu
What Were the Major Price Movements in the 1980s to 2000s?
The 1980s saw aggressive central-bank tightening to crush inflation, which precipitated a prolonged correction across precious metals as real interest rates rose and non-yielding assets carried higher opportunity costs. Throughout the 1990s, low inflation and stable growth kept gold largely range-bound near the low hundreds, while silver traded at relatively depressed levels as industrial output normalized. The 2000s introduced a commodities supercycle driven by emerging-market growth and broad commodity demand, and the 2008 financial crisis triggered flight-to-safety flows that pushed gold sharply higher into the following decade. In the wake of quantitative easing, gold found renewed institutional and retail interest, culminating in the 2008–2011 period when both metals experienced dramatic appreciation, with silver reaching near-term highs around 2011.
How Have Gold and Silver Prices Evolved from 2010 to 2025?
From 2010 forward, markets shifted from acute crisis-driven spikes toward cyclical consolidation punctuated by macro shocks, with silver showing pronounced volatility tied to industrial cycles and speculative episodes. The early 2010s retracement followed the 2011 peaks, and the subsequent decade was characterized by range-bound precious-metals prices until the global pandemic in 2020 altered monetary and fiscal dynamics. Massive policy responses, supply-chain strains, and a 2023 inflation wave increased demand for real assets; by 2025 gold’s price reached roughly $4,000 per ounce while silver approached near $48 per ounce again. These moves reflect both long-term monetary concerns favoring gold as a hedge and silver’s hybrid sensitivity to industrial recovery and speculative pushes, which together inform how investors should weight each metal in portfolios today.
How Is the Gold-Silver Ratio Defined and What Does It Reveal About Market Trends?
The gold–silver ratio is a simple market metric defined as the price of an ounce of gold divided by the price of an ounce of silver, and it reveals relative valuation, liquidity, and risk-preference shifts between the two metals. As a mechanism, the ratio condenses market sentiment rising ratios often indicate that gold is outperforming silver (flight-to-safety or weak industrial demand), while falling ratios suggest silver strength or increased industrial/ speculative appetite. The ratio’s practical benefit is to offer a rule-of-thumb for rebalancing or tactical “swap” trades: extreme historical highs or lows can signal relative mispricing. Investors use sampled datapoints to see how ratio swings align with macro events and to identify potential entry or swap opportunities within a broader portfolio context.
Below are sampled ratio datapoints that illustrate key turning points and how ratio behaviour changed across major events:
| Date | Gold Price (USD/oz) | Silver Price (USD/oz) | Gold–Silver Ratio |
|---|---|---|---|
| 1970 | $35 | $1.50 | 23.3 |
| 1980 | $850 | $49 | 17.3 |
| 2000 | $279 | $4.95 | 56.4 |
| 2011 | $1,900 | $48 | 39.6 |
| 2025 | $4,000 | $48 | 83.3 |
This sample shows how the ratio compressed during the 1980 speculative era and expanded during disinflationary periods, then widened greatly by 2025 as gold’s long-term appreciation outpaced silver; investors can use such datapoints to time relative trades and rebalancing.
What Is the Historical Evolution of the Gold-Silver Ratio?
Historically, the gold–silver ratio has oscillated between low teens during periods of strong silver demand or speculative runs, and very high levels during disinflationary or gold-dominant safe-haven phases; these swings reflect differing drivers for each metal. Industrial booms and speculative frenzies push the ratio down as silver outperforms, while monetary stress, inflation-hedging, or deep risk-off episodes push investors toward gold and widen the ratio. The empirical implication is that the ratio’s extremes tend to mean-revert over multi-year horizons, offering traders and allocators a quantitative lens for assessing relative value. Observing those patterns allows investors to combine macro signals with ratio thresholds when considering tactical swaps or long-term rebalances.
How Can Investors Use the Gold-Silver Ratio to Identify Opportunities?
Investors commonly use simple ratio-based rules of thumb such as considering accumulation of silver when the ratio is above long-run averages and favoring gold when the ratio falls below certain thresholds to structure tactical trades and rebalancing. Practical swap strategies include reducing gold allocations and increasing silver exposure when the ratio is above a high threshold (e.g., historically extreme values), and doing the reverse when the ratio compresses toward historic lows; these rules require discipline and macro confirmation. Limitations are important: ratio signals must be combined with liquidity, storage, and macro views because timing can be extended and industrial demand can keep silver elevated for sustained periods. A prudent approach uses the ratio as one input among several alongside inflation expectations, interest-rate outlook, and supply-demand fundamentals before executing swaps.
What Economic and Geopolitical Factors Influence Gold and Silver Prices?
Gold and silver are influenced by a common set of macro drivers such as inflation, central-bank policy, and geopolitical risk yet they respond differently because silver carries significant industrial demand that gold does not. Understanding these drivers helps explain why gold often behaves as a pure hedge while silver mixes monetary and cyclical industrial exposures; this distinction guides when each metal tends to outperform. Below we break out the main drivers, show historical case studies that demonstrate the causal channels, and discuss the ways each driver produces distinct price dynamics for gold versus silver.
The primary macro and geopolitical drivers include:
- Inflation and real interest rates
- Central bank policies, including quantitative easing and reserve management
- Recessions and geopolitical shocks driving safe-haven flows
- Industrial demand dynamics (electronics, solar, manufacturing)
These drivers interact: for example, low real rates and central-bank asset purchases typically boost gold demand, while industrial recovery amplifies silver’s upside during cyclical expansions.
How Does Inflation Affect Gold and Silver Price Movements?
Inflation alters real interest rates and thus the opportunity cost of holding non-yielding assets like gold and silver; rising inflation expectations with falling real rates generally support higher nominal prices for both metals. Gold typically benefits more consistently from inflation-driven demand because it is widely perceived as a monetary hedge, whereas silver’s inflation response can be amplified or muted depending on concurrent industrial demand trends. For instance, the 1970s inflation wave drove strong gold appreciation and helped lift silver until speculative dynamics and eventual regulatory responses intervened. Investors therefore monitor CPI and real-rate trends to judge the likely direction and volatility of precious-metal returns.
Precious Metals Prices, Inflation, and Monetary Policy One of the findings of particular interest, especially for South Africa, is that changes in precious metals prices, particularly gold, may serve as leading indicators for inflation and are statistically associated with interest rate dynamics. … OF THE STATISTICAL RELATIONSHIP BETWEEN PRECIOUS METALS PRICES AND OTHER MONETARY POLICY VARIABLESAND INFLATION IN SOUTH …, RT Mpofu
What Role Do Central Bank Policies and Interest Rates Play?
Central bank policies shape opportunity cost via nominal and real interest rates, and they influence reserve-management behaviour that affects structural demand central-bank gold buying is a persistent source of institutional demand for gold. Periods of accommodative policy and quantitative easing following the 2008 crisis reduced real rates and encouraged allocations to gold, while tightening cycles in prior eras, like the early 1980s, weighed on metals. Silver, lacking meaningful central-bank reserve demand, responds more to liquidity and industrial cycles, so policy shifts that alter growth expectations tend to influence silver indirectly through manufacturing and technology demand. Monitoring rate paths and central-bank balance-sheet actions is therefore central to anticipating metal price trends.
How Do Recessions and Geopolitical Events Impact Precious Metal Markets?
Recessions and geopolitical shocks typically produce safe-haven flows into gold as investors seek liquidity and asset preservation, driving rapid price appreciation during acute episodes. The 2008 financial crisis and the 2020 pandemic are clear examples where risk-off flows pushed gold higher as markets sought durability, while silver’s reaction varied sometimes rising with gold, sometimes lagging due to collapsed industrial demand. Supply disruptions or sanctions affecting mining and refining can also tighten physical markets, producing additional price pressure. Investors must weigh event-driven demand spikes against the potential for rapid mean reversion once the acute phase passes and normal economic activity resumes.
Why Does Industrial Demand Drive Silver Prices Differently Than Gold?
Silver’s substantial industrial use spanning electronics, photovoltaics, and industrial applications creates a dual-demand structure: investment and industrial. This hyphenated role means silver is sensitive to both cyclical recoveries and secular technological adoption, which can produce sharper upside during demand-led recoveries and steeper drawdowns during recessions. In contrast, gold’s primary driver is monetary and investment demand, giving it smoother performance as a safe-haven asset. Because industrial demand can shift quickly with technological adoption curves and inventory cycles, silver exhibits higher volatility and episodic divergence from gold, which investors should account for when sizing positions and evaluating storage economics.
How Do Gold and Silver Compare in Investment Performance, Volatility, and Practical Considerations?
Comparing gold and silver across performance, volatility, and practicalities reveals trade-offs: gold offers deeper liquidity and lower volatility per dollar invested, while silver can deliver higher percentage returns during cyclicals but carries higher storage and trading costs relative to investment size. Investors must weigh historical price anchors, observed volatility, storage cost per dollar, and market liquidity when selecting product types and position sizes. Below is a concise entity-attribute table that captures headline metrics and practical considerations for portfolio construction.
This table summarizes key historical price metrics and practical investment attributes for quick comparison:
| Asset | Attribute | Value |
|---|---|---|
| Gold | 1970 Price | $35 per oz |
| Silver | 1970 Price | $1.50 per oz |
| Gold | 1980 High | $850 per oz |
| Silver | 1980 High | $49 per oz |
| Gold | 2000 Avg | $279 per oz |
| Silver | 2000 Avg | $4.95 per oz |
| Gold | 2025 Price | ~$4,000 per oz |
| Silver | 2025 Price | ~$48 per oz |
| Gold | Liquidity | Deep OTC and ETFs; generally tighter spreads |
| Silver | Liquidity | Shallower on physical markets; wider spreads for small lots |
What Are the Historical Price and Volatility Differences Between Gold and Silver?
Silver historically shows higher percentage volatility than gold because its market depth is shallower and it has larger industrial demand swings; silver’s episodic spikes in 1980, 2011, and the 2020s demonstrate this amplitude. Gold, by contrast, tends to move more smoothly over long horizons, acting as a portfolio anchor during stress. These volatility characteristics mean silver can outperform on the upside but requires disciplined sizing and stop-loss planning to manage drawdowns. Understanding relative standard deviations or using volatility-adjusted position sizing helps investors align exposures with risk tolerance and portfolio objectives.
How Do Storage Costs and Liquidity Affect Gold vs. Silver Investments?
Storage and insurance costs are a material practical consideration: because silver’s per-ounce value is much lower, storing equivalent dollar exposure in silver typically requires more physical volume and higher per-dollar storage and insurance costs than gold. Dealer spreads and ease of sale also differ by product type large-format gold bars and major bullion coins trade with narrower spreads and higher dealer liquidity, while small silver coins and fractional bars often carry wider spreads. To mitigate costs, investors can consider ETFs, pooled storage, or buying larger bulk lots; each option trades off custody control, premiums, and liquidity characteristics that should align with investment horizons and security preferences.
For investors who want to act on these practical differences, BullionExpress.com provides live spreads, product availability, and an assortment of bullion formats to compare transaction costs and inventory; checking live prices and bid/ask spreads helps translate historical strategy into execution. Using a live-price source to verify spreads and availability before transacting ensures the tactical plan reflects current market liquidity and dealer inventory.
What Are the Key Investor Takeaways for Gold and Silver in 2025 and Beyond?
By 2025, the investment case for gold centers on structural monetary concerns and safe-haven demand, while silver remains a tactical play that benefits from industrial recovery and speculative episodes; both have roles within a diversified portfolio. Investors should apply ratio-based rules of thumb, manage position sizing given volatility differences, and account for storage/liquidity costs when choosing product types. Below are practical, actionable takeaways and simple allocation and rebalancing rules that synthesize the historical lessons into portfolio guidance.
Use these rules-of-thumb and tactical guidelines to translate history into action:
- Allocate by Role: Reserve gold for long-term inflation and reserve-asset exposure; use silver for tactical cyclical upside and industrial exposure.
- Ratio-Based Rebalancing: Consider increasing silver exposure when the gold–silver ratio is significantly above historical norms and trimming when it compresses.
- Size to Volatility: Size silver positions smaller than gold to account for higher percentage volatility and storage costs.
- Check Liquidity Before Trading: Verify spreads and dealer inventory for the chosen bullion format before executing trades.
When Does Gold Outperform Silver and Vice Versa?
Gold tends to outperform silver during periods of monetary stress, high inflation with weakening industrial activity, or acute geopolitical risk when investors prioritize a pure monetary hedge. Silver tends to outperform during industrial-led recoveries, technology-driven demand increases, or speculative surges that amplify small-market dynamics. Historical examples include gold’s relative strength during the 1970s inflation regime and the 2020–2025 safe-haven episodes, versus silver’s outsized runs in 1980 and 2011 when speculative and industrial forces combined. Investors should treat these patterns as tendencies rather than guarantees and combine them with macro indicators and liquidity checks before acting.
How Should Investors Use Diversification and the Gold-Silver Ratio in Their Portfolios?
A pragmatic allocation framework positions precious metals as 5–15% of a diversified portfolio, with a bias toward gold for longevity and a tactical silver sleeve for opportunistic gains; investors can rebalance using the gold–silver ratio as a trigger. For example, an investor with a 10% metals allocation might hold 7% gold and 3% silver, then rebalance when the ratio moves beyond historical thresholds moving 1% from gold into silver when the ratio exceeds an elevated level, and reversing when it compresses. Risk management includes sizing silver smaller for the same dollar exposure, holding more liquid formats for tactical trades, and using pooled or insured storage to limit custody risk. These practical steps align historical insight with execution discipline.
Where Can Investors Find Live Gold and Silver Prices and Investment Opportunities?
Accessing live prices and current product availability is essential for translating historical strategy into real trades; reliable live-price sources provide spot quotes, timestamped bid/ask spreads, and inventory transparency so investors can execute with confidence. Before buying or swapping metals, check a reputable dealer’s live prices for timestamp, currency denomination, and whether quoted figures are spot, bid, or offer. Comparing spreads across product types and confirming availability reduces execution slippage and ensures that a ratio-based rebalance or tactical silver buy is executed at expected cost and availability.
How to Access Real-Time Gold and Silver Prices on BullionExpress.com
To act on the insights in this article, use BullionExpress.com to review real-time spot prices, bid/ask spreads, and on-hand inventory for common bullion formats; this helps align historical strategy with current market execution. When viewing live prices, verify the timestamp and whether figures are quoted in your preferred currency, and confirm if the displayed price is a spot reference or an executable bid/ask quote. Checking spreads and inventory before placing an order reduces the risk of price slippage and ensures the tactical signals derived from historical analysis can be implemented efficiently.
What Investment Products Are Available for Precious Metals on BullionExpress.com?
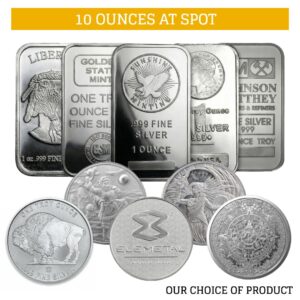
BullionExpress.com lists a range of common investment product categories that balance liquidity, premiums, and storage options, enabling investors to choose formats aligned with their goals and cost constraints. Typical product types include physical bullion bars, popular government and private mint coins, and ETF or pooled options that provide exposure without handling physical storage. Each product category has trade-offs coins and small bars offer flexibility but wider spreads, while large bars reduce premiums per dollar but require secure storage so reviewing live listings and product specs informs the optimal choice.
This final practical step connects the historical and ratio-based strategies discussed above with concrete execution: Explore today’s live gold and silver prices at BullionExpress.com and lock in your next investment.

